MAHINDRA MANULIFE DYNAMIC BOND FUND
(An open ended dynamic debt scheme investing across duration. A relatively high interest rate risk and moderate credit risk.)
 |
 |
 |
 |
 |
| Data as on 29th, February 2024 | ||||
| Investment Objective | The investment objective of the Scheme is to generate regular returns and capital appreciation through an active management of a portfolio constituted of money market and debt instruments across duration. However, there is no assurance that the investment objective of the Scheme will be realized and the Scheme does not assure or guarantee any returns. |
| Fund Features | Mahindra Manulife Dynamic Bond Yojana endeavours to take advantage of interest rate movements. With the flexibility to counter a dynamic environment, the Scheme aims to generate regular returns and capital appreciation through active management of portfolio in line with the evolving interest rate scenario. |
| Fund Manager and Experience | Fund Manager: Mr. Rahul Pal Total Experience: 22 years Experience in managing this fund: 5 years and 7 months (managing since August 20, 2018) |
| Date of allotment | August 20, 2018 |
| Benchmark | CRISIL Dynamic Bond B-III Index |
| Minimum Amount for Switch in | Rs. 1,000/- and in multiples of Re. 0.01/- thereafter. |
| Minimum Amount for Redemption / Switch-outs | Rs. 1,000/- or 100 units or account balance, whichever is lower in respect of each Option. |
| Available Plans | Direct (D) , Regular |
| Available Options under each plan | Growth (D), IDCW |
| Available Sub-Options under IDCW Option: | Discretionary (D), Quarterly |
| Available Facilities under IDCW Option | IDCW Reinvestment (D), IDCW Payout |
| SIP | Minimum Weekly & Monthly SIP Amount: Rs 500 and in
multiples of Re 1 thereafter Minimum Weekly & Monthly SIP Installments: 6 Minimum Quarterly SIP Amount: Rs 1,500 and in multiples of Re 1 thereafter Minimum Quarterly SIP installments: 4 |
| Monthly AAUM as on February 29, 2024 (Rs. in Cr.): | 67.40 |
| Monthly AUM as on February 29, 2024 (Rs. in Cr.): | 65.58 |
| Total Expense Ratio2 as on February 29, 2024: | Regular Plan: 1.57% Direct Plan: 0.39% 2Includes additional expenses charged in terms of Regulation 52(6A)(b)of SEBI (Mutual Funds) Regulations, 1996 and Goods and Services Tax. IDCW: Income Distribution cum Capital Withdrawal |
| Load Structure: | Entry Load: N.A. Exit Load: Nil |
| Annualised Portfolio YTM*1: | 7.57% |
| Macaulay Duration: | 6.85 years |
| Modified Duration: | 6.60 |
| Residual Maturity: | 11.49 years |
| As on (Date) | February 29, 2024 |
| *In case of semi annual YTM, it will be annualised 1Yield to maturity should not be construed as minimum return offered by the Scheme. |
|
| NAV/Unit | Regular Plan (In Rs.) |
Direct Plan (In Rs.) |
| Growth | 12.8971 |
13.7101 |
| IDCW | 12.1925 |
12.9765 |
| Quarterly IDCW | 10.4076 |
11.1438 |
| IDCW: Income Distribution cum Capital Withdrawal | ||
Issuer |
Rating |
% of Net Assets |
|
|---|---|---|---|
| Corporate Bond | 18.98% |
||
 |
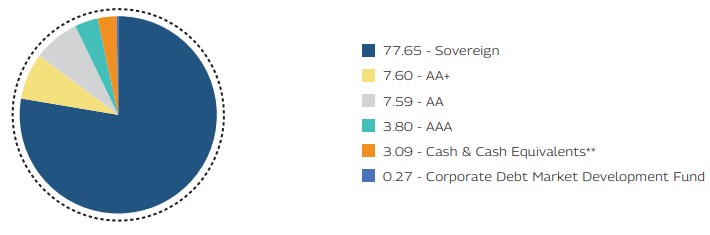
Bharti Telecom Limited | CRISIL AA+ |
7.60% |
|
360 One Prime Limited | CRISIL AA |
3.80% |
|
Embassy Office Parks REIT | CRISIL AAA |
3.80% |
|
TVS Credit Services Limited | CRISIL AA |
3.78% |
| Corporate Debt Market Development Fund | 0.27% |
||
|
Corporate Debt Market Development Fund Class A2 | 0.27% |
|
| Government Bond | 69.93% |
||
|
7.18% GOI (MD 24/07/2037) | SOV |
23.73% |
|
7.18% GOI (MD 14/08/2033) | SOV |
23.03% |
|
7.3% GOI (MD 19/06/2053) | SOV |
15.51% |
|
7.17% GOI (MD 17/04/2030) | SOV |
7.66% |
| State Government Bond | 7.73% |
||
|
7.64% Maharashtra SDL (MD 25/01/2033) | SOV |
7.73% |
| Cash & Other Receivables | 3.09% |
||
| Grand Total | 100.00% |
||
| ( Top Ten Holdings - Issuer wise) as on February 29, 2024) |
|||
| Mahindra Manulife Dynamic Bond Fund | CAGR Returns (%) |
Value of Investment of Rs. 10,000* |
NAV / Index Value (as on February 29, 2024) |
||||||
| Managed by Mr. Rahul Pal | 1 Year |
3 Years |
5 Years |
Since Inception |
1 Year |
3 Years |
5 Years |
Since Inception |
|
| Regular Plan - Growth Option | 7.53 |
3.71 |
4.64 |
4.71 |
10,755 |
11,159 |
12,547 |
12,897 |
12.8971 |
| Direct Plan - Growth Option | 8.75 |
4.86 |
5.80 |
5.87 |
10,877 |
11,535 |
13,257 |
13,710 |
13.7101 |
| CRISIL Dynamic Bond Fund BIII Index^ | 7.34 |
6.70 |
8.36 |
8.02 |
10,736 |
12,154 |
14,947 |
15,324 |
6,040.09 |
| CRISIL 10 Yr Gilt Index^^ | 9.39 |
4.37 |
6.21 |
6.66 |
10,942 |
11,374 |
13,518 |
14,287 |
4,523.48 |
^Benchmark ^^Additional Benchmark. CAGR – Compounded Annual Growth Rate. Inception/Allotment date: 20-Aug-18. Past performance may or may not be sustained in future and should not be used as a basis of comparison with other investments. Since inception returns of the scheme is calculated on face value of Rs. 10 invested at inception. The performance details provided above are of Growth Option under Regular and Direct Plan. Different Plans i.e Regular Plan and Direct Plan under the scheme has different expense structure. *Based on standard investment of Rs. 10,000 made at the beginning of the relevant period. For performance details of other schemes managed by the Fund Manager(s), please click here | Best Viewed in Landscape mode
| Mahindra Manulife Dynamic Bond Fund | Regular Plan |
Direct Plan |
CRISIL Dynamic Bond Fund BIII Index ^ |
CRISIL 10 Yr Gilt Index^^ |
|||||
| SIP Investment Period | Total Amount Invested (  ) ) |
Market Value ( ) |
CAGR Returns (%) |
Market Value ( ) |
CAGR Returns (%) |
Market Value ( ) |
CAGR Returns (%) |
Market Value ( ) |
CAGR Returns (%) |
| 1 Year | 120,000 |
124,768 |
7.48 |
125,556 |
8.73 |
124,220 |
6.61 |
125,361 |
8.42 |
| 3 Years | 360,000 |
387,726 |
4.89 |
394,541 |
6.05 |
396,166 |
6.33 |
392,829 |
5.76 |
| 5 Years | 600,000 |
669,118 |
4.31 |
688,831 |
5.47 |
716,359 |
7.03 |
681,695 |
5.05 |
| Since Inception | 660,000 |
745,722 |
4.39 |
770,024 |
5.55 |
807,740 |
7.28 |
765,395 |
5.33 |
^Benchmark ^^Additional Benchmark. CAGR – Compounded Annual Growth Rate. Inception/Allotment date: 20-Aug-18. Past performance may or may not be sustained in future and should not be used as a basis of comparison with other investments. Returns greater than 1 year period are compounded annualized. For SIP returns, monthly investment of equal amounts invested on the 1st business day of every month has been considered. CAGR Returns (%) are computed after accounting for the cash flow by using the XIRR method (investment internal rate of return). For SIP Performance please click here | Best Viewed in Landscape mode
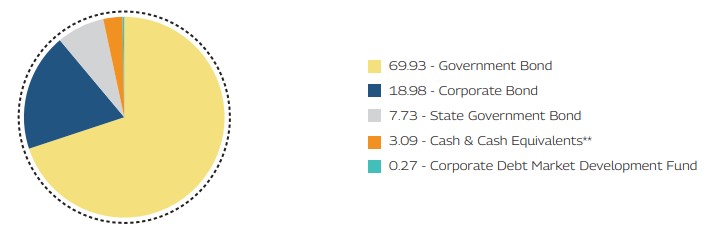
**Cash & Cash Equivalents includes Fixed Deposits, Cash & Current Assets and TREPS
**Cash & Cash Equivalents includes Fixed Deposits, Cash & Current Assets and TREPS
Record Date |
Plan(s)/Option(s) |
Individuals/HUF (IDCW) |
Others (IDCW) |
Face Value |
Cum-IDCW NAV |
(Rs. per unit) |
(Rs. per unit) |
(Rs. per unit) |
(Rs. per unit) |
||
27-Feb-23 |
Quarterly Regular IDCW |
0.10 |
0.10 |
10 |
10.2175 |
27-Feb-23 |
Quarterly Direct IDCW |
0.10 |
0.10 |
10 |
10.7811 |
15-Sep-23 |
Quarterly Regular IDCW |
0.25 |
0.25 |
10 |
10.4843 |
15-Sep-23 |
Quarterly Direct IDCW |
0.25 |
0.25 |
10 |
11.1362 |
15-Dec-23 |
Quarterly Regular IDCW |
0.20 |
0.20 |
10 |
10.3334 |
15-Dec-23 |
Quarterly Direct IDCW |
0.20 |
0.20 |
10 |
11.0233 |
Pursuant to payment of IDCW, the NAV of the IDCW Option(s) of the Scheme/Plan(s) falls to the extent of payout and statutory levy, if any. Past performance may or may not be sustained in future and should not be used as a basis for comparison with other investments. For complete list of IDCWs, visit www.mahindramanulife.com. |
|||||
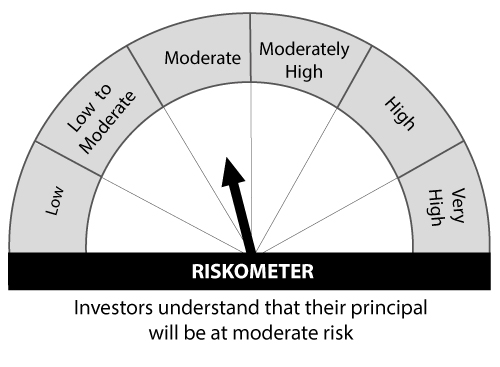
Product Suitability |
|
| This Product is Suitable for investors who are seeking* | |
|
|
Scheme Riskometers |
Benchmark Riskometers |
 |
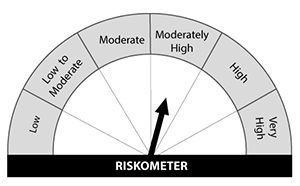 Scheme Benchmark: CRISIL Dynamic Bond B-III Index |
* Investors should consult their financial advisers if in doubt about whether the product is suitable for them. |
|
| Refere to the PRCM disclosure click here | |